by admin | Jan 31, 2017 | Health Plan Benchmarking
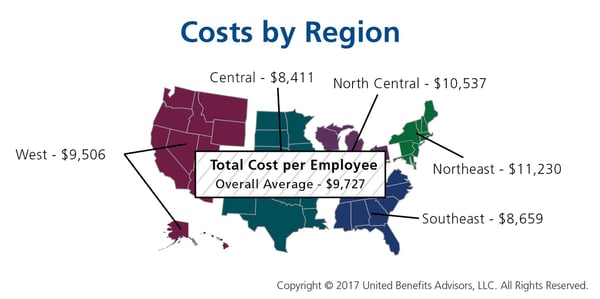
Many employers benchmark their health plan against carrier provided national data. While that is a good place to start, regional cost averages vary, making it essential to benchmark both nationally and regionally—as well as state by state. For example, a significant difference exists between the cost to insure an employee in the Northeast versus the Central U.S.—plans in the Northeast continue to cost the most since they typically have lower deductibles, contain more state-mandated benefits, and feature higher in-network coinsurance, among other factors.
Drilling down even more, comparing yourself to your industry peers can tell a very different story.

Consider a manufacturing plant in Georgia that offers a PPO. Its premium cost for single coverage is $507 per month. Compare this with the benchmarks for all plans and you can see that it is $2 per month less than the national average. When compared with other PPOs in the Southeast region, this employer’s cost is actually $2 more than the average. This employer’s cost appears to be higher or lower compared with national and regional benchmarks, depending on which benchmark is used. Yet this employer’s cost is actually higher than its closest peers’ costs when using the state-specific benchmark, which in Georgia is $468. Bottom line, this employer’s monthly single premium is actually $39 more than its competitors in the state.
As our CEO, Les McPhearson, recently stated, “Benchmarking by state, region, industry, and group size is critical. We see it time and time again, especially with new clients. An employer benchmarks their rates nationally and they seem at or below average, but once we look at their rates by plan type across multiple carriers and among their neighboring competitors or like-size groups, we find many employers leave a lot on the bargaining table.”
By RJ Nelson, Originally Published By United Benefit Advisors

by admin | Jan 26, 2017 | Benefit Management, Employee Benefits, Retirement
Employers I’ve talked to all have the same goal: to help employees build a sound retirement plan to achieve financial success and security. The main components to protect an employee’s financial future are managing a nest egg, growing investments, and safeguarding against uncertainty.
The Missing Component
As an employer, you may be missing a key component in safeguarding against uncertainty – the need for long-term care. Seventy-five percent of people over the age of 65 will need some form of long-term care in their lifetime1, however, far fewer are financially prepared to handle that need. With nursing home costs averaging $84,000 per year2, it’s not surprising that many Americans are having to spend down their retirement savings to pay for care. Long-term care is custodial care received in an assisted living facility, nursing home, or your own home should you need assistance with activities of daily living or suffer from a severe cognitive impairment.
Long Term Care Insurance
Savvy employers are helping fill the uncertainty gap by introducing long-term care insurance to employees. Employers can offer long-term care insurance plans with reduced underwriting and group pricing that employees wouldn’t be able to get as an individual. Better pricing and easier approval make the product accessible to employees that couldn’t normally qualify for coverage.
Long-term care education is key to helping employees protect their retirement savings. Without your help, employees can fall victim to widely held misconceptions. They may think:
- Other benefits will cover them
- The government will pay for their care
- This is only for old people
The truth is that long-term care insurance is the only benefit that covers this type of custodial care, and government options (Medicaid) are only available to people with low income and limited resources.
Shield and Supplement the 401(k)
Do you already contribute to your employees’ 401(k) plan? If so, you can spend the same amount of employer dollars, but provide richer benefits by pairing a 401(k) with long-term care insurance. By taking a small amount of contributions from the 401(k) plan and directing those toward your long-term care insurance premium, the resulting benefit can provide more than $200,000 of long-term care coverage and only slightly adjust the total 401(k) plan value.
Unlike other benefits, where providers may change from year to year, the majority of long-term care insurance purchasers will hold on to their original plan for life, and 99 percent of employees who have the coverage keep it when they move to their next employer, or into retirement. You can think of it as a “legacy benefit” that employees maintain for life to protect their retirement savings.
By Megan Fromm, Originally published by United Benefit Advisors

by admin | Jan 24, 2017 | Benefit Management, Employee Benefits
Determining how an employer develops the most effective formulary, while protecting the financial stability of the plan, is certainly the challenge of this decade. Prescription management used to mean monitoring that the right people are taking medications to control their disease while creating strategies to move them from brand name to generic medications. With the dawn of specialty medications, formulary management has become a game of maximizing the pass-through of rebates, creating the best prior authorization strategies and tiering of benefits to create some barrier to more expensive medications, all without becoming too disruptive. As benefits managers know, that is a difficult challenge. The latest UBA Health Plan Survey revealed that 53.6 percent of plans offer four tiers or more, a 21.5 percent increase from last year and nearly a 55.5 percent increase in just two years. Thus, making “tiering” a top strategy to control drug costs. There are many additional opportunities to improve and help control the pharmacy investment, but focusing on the key components of formulary management and working on solutions that decrease the demands for medications are critical to successful plan management.
When developing a formulary, Brenda Motheral, RPh, MBA, Ph.D., CEO of Archimedes, suggests that chasing rebates is not a strategy to optimize your investment. Some of the highest rebates may be from medications that add no better therapeutic value than an inexpensive medication that does not offer a rebate, but net cost is much lower than the brand or specialty medication being offered. Best formulary management will mean that specific medications that do not offer a significant therapeutic value are removed from the formulary, or are covered at a “referenced price” so the member pays the cost difference. Formulary management will need to focus on where the drug is filled and which medications are available.
When setting up parameters on where a drug is to be filled, the decision needs to be made if a plan will promote mail order. Mail order, if used and monitored appropriately, makes it more convenient for a patient to receive their regularly used medications and may provide savings. In fact, the UBA Health Plan Survey finds that more than one-third (36.3 percent) of prescription drug plans provide a 90-day supply at a cost of two times retail copays. But if mail order programs are not monitored, people can continue to receive medications that are no longer required and never used, adding to medical spend waste. Furthermore, in our analysis, we are finding that not all medications are less expensive through mail order, as shown in Figure 1 below. Therefore, examining the cost differential is critical in a decision to promote, or not promote, mail order.
Figure 1
| Drug Name |
Rx Category |
Mail Order |
Retail |
| Zytiga® |
Malignancies |
$8,749 |
$6,027 |
| Sumatriptan Succinate |
Migrane / Neurologic |
$575 |
$308 |
| Ranexa® |
Cardiovascular |
$259 |
$413 |
Another formulary consideration is in monitoring the increase in same drug pricing. The stories surrounding the price increases of EpiPens® has been well-documented, but how well do you understand the impact of price increases on your plan? Monitoring price increases, as shown in Figure 2, may help an employer turn to their pharmacy benefit manager (PBM) to ask for help in controlling these price increases, or help in decisions related to formulary inclusion.
Figure 2
| Drug Name |
Rx Category |
Plan Paid per
30-day Supply
(SPLY) |
Plan Paid per
30-day Supply |
| Cialis® |
Genito-Urinary / Acute Minor |
$287 |
$442 |
| AndroGel® |
Endocrine / Chronic Meidcal |
$471 |
$523 |
| Viagra® |
Genito-Urinary / Acute Minor |
$615 |
$978 |
Formulary management solutions can become a cat-and-mouse game. The ultimate approach to manage the total spending on medications is by managing the growing demand. There has been significant press related to the opioid overutilization in the U.S., as illustrated in the article “Prescription Addiction.” But that issue is much broader in our society and relates to taking a pill as a quick solution to solve our medical problems. In March 2016, the Department of Health and Human Services (HHS) stated that 30 percent of the growth in spending related to medications was due to an increase in prescriptions per person. Certainly, medications should be used when there are no alternatives to control disease or pain. However, turning to medications as a first option for chronic condition control for issues like hypertension, blood sugar control, cholesterol control versus improving diet and exercise, etc., is just a band-aid solution that, in most cases, does not resolve the root issue. Yet, because this is sold as a quick fix, we see an increase in the number of individuals on medications. In 2012, 34 percent of plan members engaged in Vital Incite were taking four or more (active ingredients) medications, and that has grown to more than 45 percent in 2016. The data also illustrates that in 2012 more than 42 percent of members were not on any medications, but that group size has shrunk to only 27 percent. No formulary can impact this issue.

This increased use could be considered an improvement in care if their disease were more controlled. Appropriate and medically-impactful utilization would mean that a person is working toward improving diet and exercise and is taking the least expensive, yet effective, medication to control his or her disease.
Considering that diabetes medication options have really expanded, an employer would hope that the more expensive medication is providing the best control of disease. But, taking the medication alone will not control the disease and, at times, the progression of the medication cost can be related to progression of the disease due to a lack of disease management. For instance, a diabetic may have progressed from taking metphormin (marketed under the tradename Glucophage® among others), which costs approximately $27 per month, to metphormin ER (Glucophage® XR), which allows a person to take only one pill a day, so it may provide increased compliance, but costs $274 per month. Now, the option of taking Glumetza® is offered, which can be reimbursed at up to $3,620 per month, and is said to provide more stable results. But, if we examine the A1c control values from Vital Incite, do we find the reduction in A1c values as evidence that this additional investment in medication options is providing better control? Figure 3 provides an example of A1c control by prescription status. The goal would be that those on medications will become controlled. But, in our data, we are not seeing a significant improvement in persons with HgA1c levels above 7 percent. Control is achieved from diet, exercise, and appropriate medications. There are theories that people on these more expensive medications are using that as an approach to help them maintain their unhealthy behaviors. Therefore, taking medications alone does not appear to provide an effective solution and, in fact, providing chronic condition medications for free, without requiring any other effort, may not be the best investment for an employer.
Figure 3
| HgA1c Level |
In Treatment |
Untreated |
Discontinued
Treatment |
Possibly
Untreated |
| < 5.7 |
6 |
1 |
2 |
3 |
| 5.7 to 6.4 |
21 |
2 |
1 |
11 |
| 6.5 to 7.0 |
17 |
|
|
7 |
| > 7.0 |
53 |
4 |
|
5 |
In conclusion, determining which issues are having the most impact on an employer group will allow benefits managers to determine the company’s priorities. This is not an easy task, but with pharmacy spend increasing at a national average of 7.3 percent annually and becoming a higher percentage of the overall medical spend, new strategies need to be considered. Focusing on the key components that balance formulary management with the correct approach to manage the demand on medications can influence total pharmacy spend.
By Mary Delaney, United Benefit Advisors

by admin | Jan 18, 2017 | ACA, Compliance, ERISA
Proposed regulations for revising and greatly expanding the Department of Labor (DOL) Form 5500 reporting are set to take effect in 2019. Currently, the non-retirement plan reporting is limited to those employers that have more than 100 employees enrolled on their benefit plans, or those in a self-funded trust. The filings must be completed on the DOL EFAST2 system within 210 days following the end of the plan year.
What does this expanded number of businesses required to report look like? According to the 2016 United Benefit Advisors (UBA) Health Plan Survey, less than 18 percent of employers offering medical plans are required to report right now. With the expanded requirements of 5500 reporting, this would require the just over 82 percent of employers not reporting now to comply with the new mandate.
While the information reported is not typically difficult to gather, it is a time-intensive task. In addition to the usual information about the carrier’s name, address, total premium, and payments to an agent or broker, employers will now be required to provide detailed benefit plan information such as deductibles, out-of-pocket maximums, coinsurance and copay amounts, among other items. Currently, insurance carriers and third party administrators must produce information needed on scheduled forms. However, an employer’s plan year as filed in their ERISA Summary Plan Description, might not match up to the renewal year with the insurance carrier. There are times when these schedule forms must be requested repeatedly in order to receive the correct dates of the plan year for filing.
In the early 1990s small employers offering a Section 125 plan were required to fill out a 5500 form with a very simple 5500 schedule form. Most small employers did not know about the filing, so noncompliance ran very high. The small employer filings were stopped mainly because the DOL did not have adequate resources to review or tabulate the information.
While electronic filing makes the process easier to tabulate the information received from companies, is it really needed? Likely not, given the expense it will require in additional compliance costs for small employers. With the current information gathered on the forms, the least expensive service is typically $500 annually for one filing. Employers without an ERISA required summary plan description (SPD) in a wrap-style document, would be required to do a separate filing based on each line of coverage. If an employer offers medical, dental, vision and life insurance, it would need to complete four separate filings. Of course, with the expanded information required if the proposed regulations hold, it is anticipated that those offering Form 5500 filing services would need to increase with the additional amount of information to be entered. In order to compensate for the additional information, those fees could more than double. Of course, that also doesn’t account for the time required to gather all the data and make sure it is correct. It is at the very least, an expensive endeavor for a small business to undertake.
Even though small employers will likely have fewer items required for their filings, it is an especially undue hardship on many already struggling small businesses that have been hit with rising health insurance premiums and other increasing costs. For those employers in the 50-99 category, they have likely paid out high fees to complete the ACA required 1094 and 1095 forms and now will be saddled with yet another reporting cost and time intensive gathering of data.
Given the noncompliance of the 1990s in the small group arena, this is just one area that a new administration could very simply and easily remove this unwelcome burden from small employers.
By Carol Taylor, Originally published by United Benefit Advisors – Read More