
by admin | Aug 29, 2017 | ACA, Health Plan Benchmarking
Small employers, those with fewer than 100 employees, have a reputation for not offering health insurance benefits that are competitive with larger employers, but new survey data from UBA’s Health Plan Survey reveals they are keeping pace with the average employer and, in fact, doing a better job of containing costs.
According to our new special report: “Small Businesses Keeping Pace with Nationwide Health Trends,” employees across all plan types pay an average of $3,378 toward annual health insurance benefits, with their employer picking up the rest of the total cost of $9,727. Among small groups, employees pay $3,557, with their employer picking up the balance of $9,474 – only a 5.3 percent difference.
When looking at total average annual cost per employees for PPO plans, small businesses actually cut a better deal even compared to their largest counterparts—their costs are generally below average—and the same holds true for small businesses offering HMO and CDHP plans. (Keep in mind that relief such as grandmothering and the PACE Act helped many of these small groups stay in pre-ACA plans at better rates, unlike their larger counterparts.)

Think small businesses are cutting coverage to drive these bargains? Compared to the nations very largest groups, that may be true, but compared to average employers, small groups are highly competitive.
By Bill Olson
Originally Published By United Benefit Advisors

by admin | Jul 25, 2017 | Group Benefit Plans, Health Plan Benchmarking
Modern medicines have resulted in longer, more productive lives for many of us. Prescription drugs soothe sore muscles after a strenuous workout or manage the conditions of a chronic disease. Unfortunately, this use of prescriptions drugs can come with a hefty price tag.
Americans are spending more money on prescription drugs than ever before and the United States as a nation spends more per capita on prescription drugs than any other country. With the cost of some drugs exceeding thousands of dollars for a 30-day supply, this can translate into financial hardship for many Americans.
For employers sponsoring a medical plan, managing the cost of these prescription drugs is also becoming a task. Insurance companies and employers struggle with the ability to provide affordable medical plans, and the ever-increasing prescription drug costs are a primary driver of this difficulty. As a result, prescription drug plan designs are changing shape – moving to a model that helps push more of the cost of these drugs to the member along with increasing awareness of the true cost of the prescriptions.
Flat dollar copay plans have become an expected norm in medical plans for almost a decade. However, insurance companies underwriting fully insured medical plans and employers sponsoring self-funded medical programs now need to make modifications to these plan designs to manage the ever-increasing prescription drug costs. As a result, we are seeing more prescription drug plans combining some aspect of coinsurance along with or in place of the flat dollar copayments.
According to the 2016 UBA Health Plan Survey, copay models are still the most popular, with a three-tier copay structure the most prevalent. Median retail copayments for these three-tier plans are $10 for generic drugs, $35 for preferred brand drugs (drugs on the carrier’s prescription drug list) and $60 for non-preferred brand drugs (drugs not on the carrier’s prescriptions drug list). While 54.5 percent of all prescription plans are copay only, approximately 40 percent of all prescription drug plans have co-insurance along with (or in lieu of) copays–a plan design that is particularly common among four-tier plans.
Coinsurance models have many unique designs. Some plans are a straight percentage of the cost of the drug; some may involve a maximum or minimum dollar copayment combined with the coinsurance. For example, a plan may require 40 percent coinsurance for a preferred brand drug, but there is a minimum copayment of $30 and a maximum copayment of $50. Typically, we see a higher coinsurance percentage for non-preferred brand drugs and specialty drugs. The member cost of the drug is calculated after any negotiated discounts, so members covered by a coinsurance plan are reaping the benefits of any discounts negotiated with the pharmacy by the pharmacy benefit manager (PBM).
Coinsurance plans do provide several advantages to managing prescription drug costs. Under a flat dollar copay plan design, members may not truly understand the full cost of the drug they are purchasing. Pharmacies are now disclosing the full cost of drugs on the purchase receipts. Yet, most consumers do not take note of this disclosure, focusing only on the copayment amount. When a member pays a percentage of the cost of the drug as in a coinsurance model, the true cost of the drug becomes much more apparent.
Another advantage of the coinsurance model is that it automatically increases the member share of the cost as the price of the drug increases. Under the flat dollar copayment model, as the true cost of the drug increases, the member pays a smaller portion of the total cost. When the member’s portion is determined by a coinsurance percentage, the member pays more as the cost of the drug increases.
As the costs of health care overall continue to increase, we all need to become better consumers of our healthcare. Members covered by a prescription drug plan with a coinsurance model will have a better understanding of the true cost of their prescriptions. As members become more aware of the true costs of their care, they make better health care decisions, managing the overall cost of care.
We expect to see prescription drug benefit plans change even more as the cost of health care – especially prescription drugs – escalates. These changes will likely result in more of the cost being pushed to the patient. There are resources available to patients for assistance with some of these out-of-pocket costs. It is vital for the patient to understand their costs and know how to maximize their benefits. In a few weeks, the UBA blog will highlight some of these resources and provide information on how to educate employees on maximizing their benefits and the industry resources available to them.
For all the cost and design trends related to health and prescription drug plan costs by group size, industry and region, download UBA’s Health Plan Survey Executive Summary.
By Mary Drueke-Collins
Originally Posted By www.ubabenefits.com

by admin | Feb 28, 2017 | Benefit Management, Employee Benefits, Health Plan Benchmarking, Human Resources
Employer-sponsored health insurance is greatly affected by geographic region, industry, and employer size. While some cost trends have been fairly consistent since the Patient Protection and Affordable Care Act (ACA) was put in place, UBA finds several surprises in its latest Health Plan Survey. Based on responses from more than 11,000 employers, UBA recently announced the top five best and worst states for group health care monthly premiums.
The top five best (least expensive) states are:
1) Hawaii
2) Idaho
3) Utah
4) Arkansas
5) Mississippi
Hawaii, a perennial low-cost leader, actually experienced a nearly seven percent decrease in its single coverage in 2016. New Mexico, a state that was a low-cost winner in 2015, saw a 22 percent increase in monthly premiums for singles and nearly a 30 percent increase in monthly family premiums, dropping it from the “best” list.
The top five worst (most expensive) states are:
1) Alaska
2) Wyoming
3) New York
4) Vermont
5) New Jersey
The UBA Health Plan Survey also enables state ranking based on the average annual cost per employee. The average annual cost per employee looks at all tiers of a plan and places an average cost on that plan based on a weighted average metric. While the resulting rankings are slightly different, they also show some interesting findings.
The 2016 average annual health plan cost per employee for all plan types is $9,727, which is a slight decrease form the average cost of $9,736 in 2015. When you start to look at the average annual cost by region and by state, there is not much change among the top from last year. The Northeast region continues to have the highest average annual cost even with the continued shift to consumer-driven health plans (CDHP). In 2016, enrollment in CDHPs in the Northeast was 34.9 percent, surpassing those enrolled in preferred provider organization (PPO) plans at 33 percent. Even with the continued shift to CDHPs, the average annual costs were $12,202 for New York, which remained the second-highest cost state, followed by $12,064 for New Jersey, and rounding out the top five, Massachusetts and Vermont flip-flopped from 2015 with Massachusetts at $11,956 and Vermont at $11,762.
As was the case in 2015, Alaska continues to lead all states in average health plan costs, topping New York by more than $1,000 per employee, with an average cost of $13,251. While year-over-year the average cost for Alaska only increased 3.35 percent, the gap increased to 36.2 percent above the national average of $9,727.
Keeping close to the national average increase, the top five states all saw a year-over-year increase of less than 4.5 percent. Unfortunately, even at a modest increase, the one thing that the top five have in common is that they all are more than 20 percent above the national average for health plan costs per employee.
By Matt Weimer, Originally Published By United Benefit Advisors
by admin | Feb 20, 2017 | Group Benefit Plans, Health Plan Benchmarking
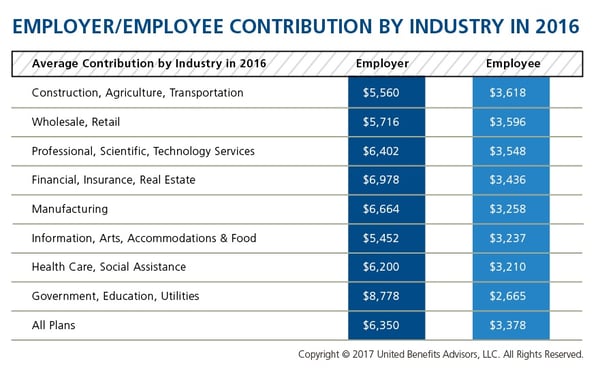
We recently shared healthcare cost benchmarking best practices and reported on the best and worst industries/states for group healthcare. But how much are you contributing toward healthcare costs vs. your employees? That’s a key benchmark, especially when “cost-shifting” is the main strategy for mitigating risk for employers. You may have the most affordable plan, but if you are passing most of that cost on to your employees, you may not be a competitive employer.
According to the latest UBA Health Plan Survey, total costs per employee for the retail, construction, and hospitality sectors are 4.3 percent to 11.3 percent lower than average, making employees in these industries among the least expensive to cover. But employees in the retail and construction sectors pay 6.3 percent and 6.8 percent above the average employee contribution, respectively (hospitality employees pay slightly below the average employee contribution).
On the other end of the cost spectrum, the government sector has the priciest plans ($11,443 per employee) and passes on the least cost to employees, whose average contributions are more than 23 percent less than average. (Surprisingly, these employees are experiencing sticker shock this year since they’ve seen a 26.6 percent increase in their contributions, which were 45.2 percent below average last year.)
When employees’ out of pocket costs are rising, carefully considering and benchmarking their contributions toward the total cost is important—and not nationally, but compared to your peers. Here’s a look at all the average employer/employee contributions by industry:
By RJ Nelson, Originally Published By United Benefit Advisors
by admin | Jan 31, 2017 | Health Plan Benchmarking
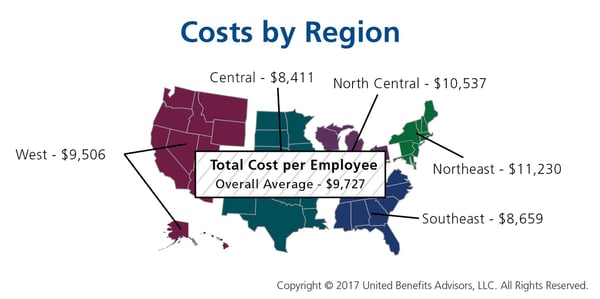
Many employers benchmark their health plan against carrier provided national data. While that is a good place to start, regional cost averages vary, making it essential to benchmark both nationally and regionally—as well as state by state. For example, a significant difference exists between the cost to insure an employee in the Northeast versus the Central U.S.—plans in the Northeast continue to cost the most since they typically have lower deductibles, contain more state-mandated benefits, and feature higher in-network coinsurance, among other factors.
Drilling down even more, comparing yourself to your industry peers can tell a very different story.

Consider a manufacturing plant in Georgia that offers a PPO. Its premium cost for single coverage is $507 per month. Compare this with the benchmarks for all plans and you can see that it is $2 per month less than the national average. When compared with other PPOs in the Southeast region, this employer’s cost is actually $2 more than the average. This employer’s cost appears to be higher or lower compared with national and regional benchmarks, depending on which benchmark is used. Yet this employer’s cost is actually higher than its closest peers’ costs when using the state-specific benchmark, which in Georgia is $468. Bottom line, this employer’s monthly single premium is actually $39 more than its competitors in the state.
As our CEO, Les McPhearson, recently stated, “Benchmarking by state, region, industry, and group size is critical. We see it time and time again, especially with new clients. An employer benchmarks their rates nationally and they seem at or below average, but once we look at their rates by plan type across multiple carriers and among their neighboring competitors or like-size groups, we find many employers leave a lot on the bargaining table.”
By RJ Nelson, Originally Published By United Benefit Advisors