We recently shared healthcare cost benchmarking best practices and reported on the best and worst industries/states for group healthcare. But how much are you contributing toward healthcare costs vs. your employees? That’s a key benchmark, especially when “cost-shifting” is the main strategy for mitigating risk for employers. You may have the most affordable plan, but if you are passing most of that cost on to your employees, you may not be a competitive employer.
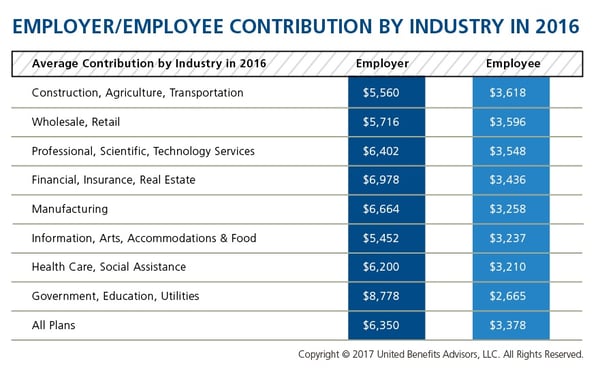
According to the latest UBA Health Plan Survey, total costs per employee for the retail, construction, and hospitality sectors are 4.3 percent to 11.3 percent lower than average, making employees in these industries among the least expensive to cover. But employees in the retail and construction sectors pay 6.3 percent and 6.8 percent above the average employee contribution, respectively (hospitality employees pay slightly below the average employee contribution).
On the other end of the cost spectrum, the government sector has the priciest plans ($11,443 per employee) and passes on the least cost to employees, whose average contributions are more than 23 percent less than average. (Surprisingly, these employees are experiencing sticker shock this year since they’ve seen a 26.6 percent increase in their contributions, which were 45.2 percent below average last year.)
When employees’ out of pocket costs are rising, carefully considering and benchmarking their contributions toward the total cost is important—and not nationally, but compared to your peers. Here’s a look at all the average employer/employee contributions by industry:

By RJ Nelson, Originally Published By United Benefit Advisors
